When a query is slow, the instinct is to look at the indexes. That's usually the right instinct — but reading raw index definitions tells you what exists, not what the planner chose. explain() tells you what actually happened.
The three modes
MongoDB's explain() takes one of three verbosity levels:
db.collection.find(query).explain();                    // queryPlanner
db.collection.find(query).explain("executionStats");    // + actual counts
db.collection.find(query).explain("allPlansExecution"); // + rejected plans
Start with "executionStats" every time. "queryPlanner" tells you what the planner intended to do; "executionStats" tells you what it did.
The three numbers that matter
{
  "nReturned":          12,
  "totalKeysExamined":  4821,
  "totalDocsExamined":  4821,
  "executionTimeMillis": 38
}
The ratio totalKeysExamined / nReturned — call it your selectivity score — tells you almost everything:
- ~1.0 — perfect. The index returned exactly what you asked for.
- 10–100 — acceptable for range queries on high-cardinality fields.
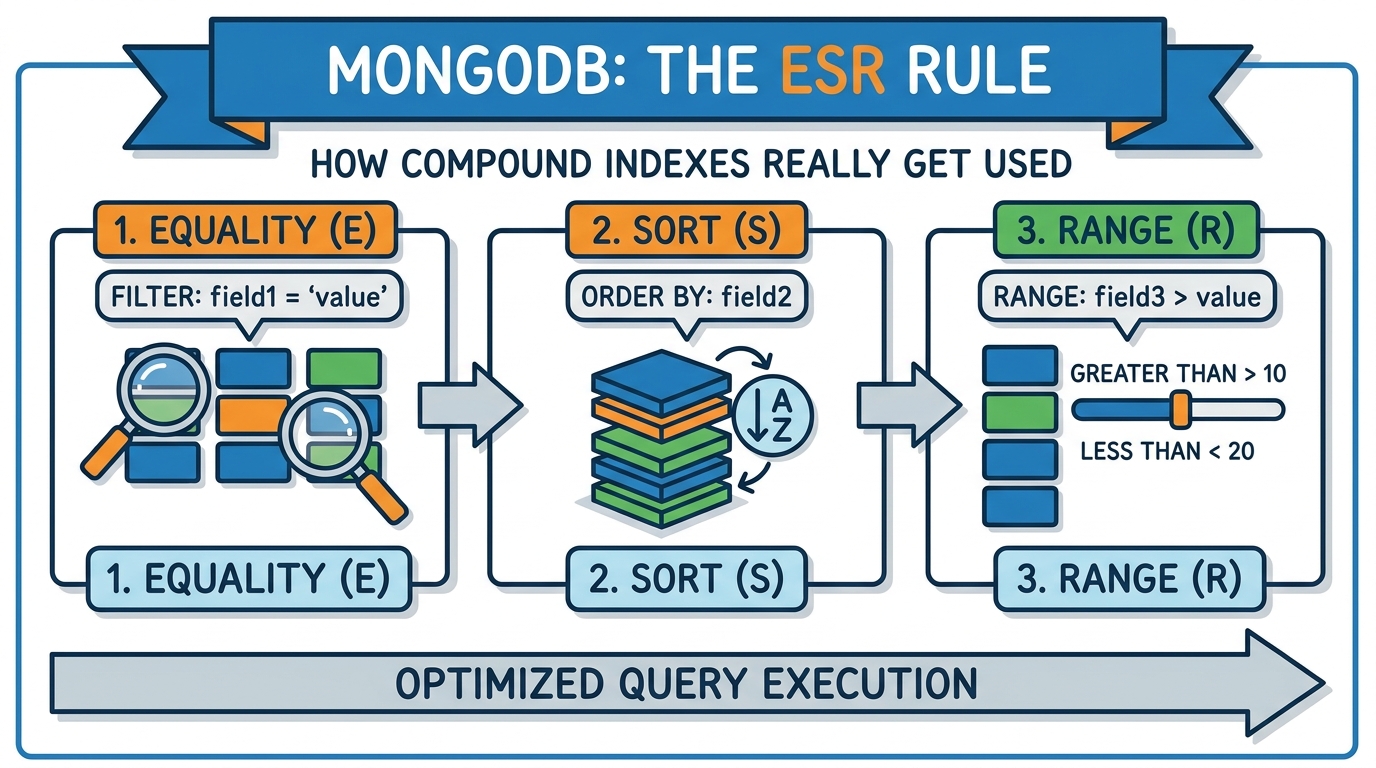
- >500 — something is wrong. Either no useful index, bad ESR order, or the planner gave up and scanned.
If totalDocsExamined is much higher than nReturned but totalKeysExamined is low, the index is selective but the documents aren't. This usually means your projection needs work, not your index.
Reading the stage tree
The executionStages key gives you a tree of plan stages. The most important ones:
| Stage | What it means |
|---|---|
COLLSCAN |
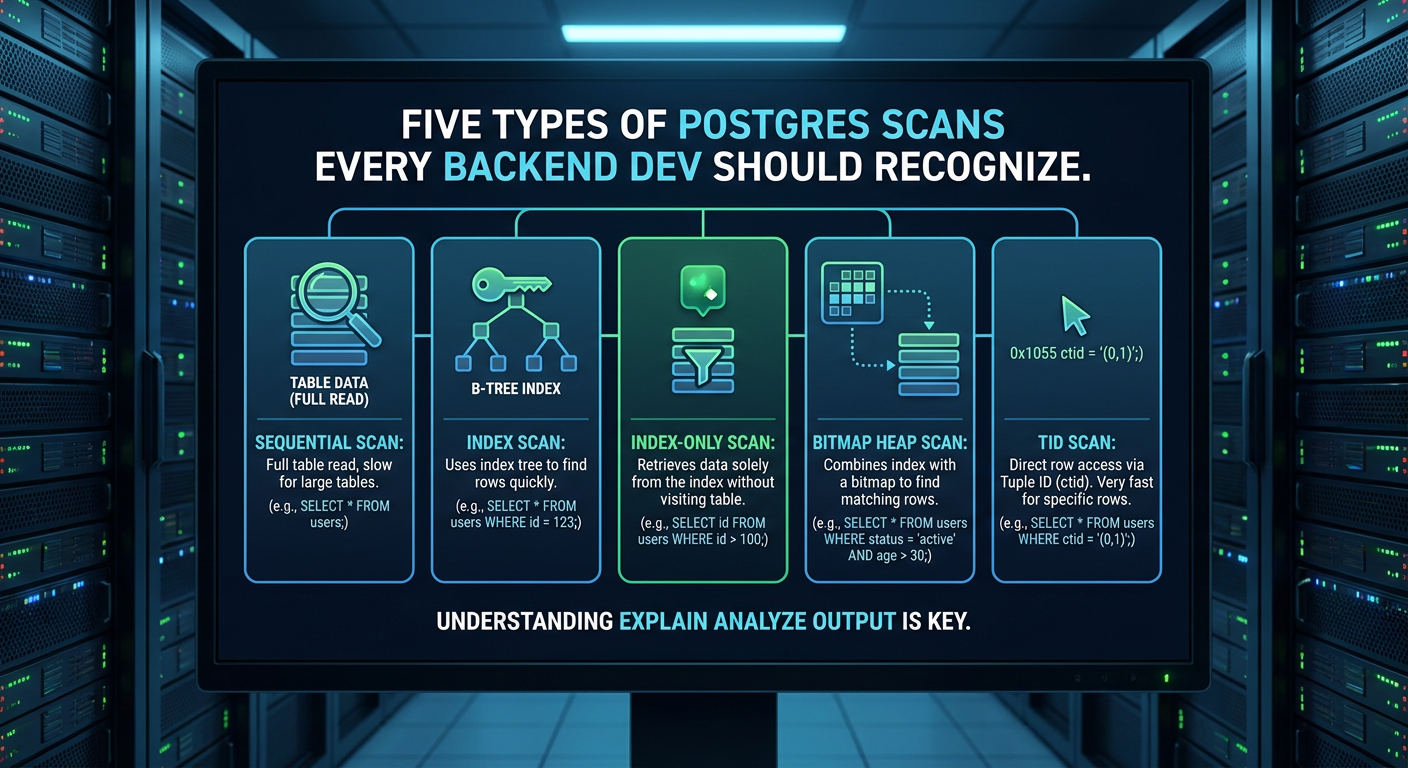
Full collection scan. No index used. |
IXSCAN |
Index scan. Check keysExamined. |
FETCH |
Fetch from heap after index. Normal. |
SORT |
In-memory sort. Check memUsage. |
SORT_MERGE |
Merging pre-sorted index results. Usually fine. |
A SORT stage at the top of the tree with memUsage above 32MB means MongoDB spilled to disk. That's never fast.
When the planner picks the wrong index
MongoDB caches plan selections per query shape. If you've changed your data distribution since the cache was populated, the cached plan might be stale. Clear it:
db.collection.getPlanCache().clear();
Then run the query again. If explain() now shows a better plan, you've found a cache staleness bug.
Next steps
Once you've read the stats and found your COLLSCAN or high key ratio, the next article covers how to structure the index correctly using the ESR rule.